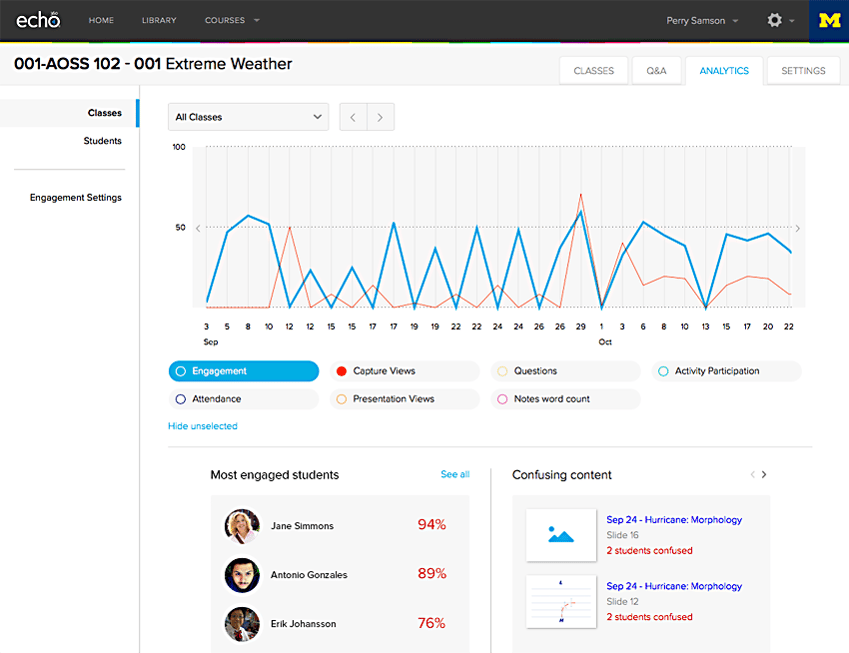
With traditional lecture capture solutions, instructors and academic leadership can chart the number of recording views. That’s helpful - if you’re selling advertising on YouTube. Not likely for most educators.
More than ever, institutions want to know how their tech investments – including lecture capture - improve teaching and learning, and more specifically, student outcomes. Simple measurement of video views doesn’t provide crucial insight into teaching activities or student behaviors that signal improved efficiency or better outcomes.
What are the ideal learning analytics from lecture capture that will help you measure outcome improvements? Here’s a handy list to get you started (and also happen to be part of lecture capture in the Echo360 Active Learning Platform):
- Slide AND Video Views: Viewership is still the baseline for analytics, but must include more than just views of a video. Instructors also need to know what content students see – this means also tracking slides and visuals by timestamp. Your instructors will not only know cumulative views, but hot spots in both the video and presentation.
- Where Students are Confused: Get a direct message every time a student clicks on the built-in confused flag. These flags indicate specific areas of content in the recording or slides where a student is lost or struggling. Not only does it help an instructor remediate one student, he can spot trends in material if multiple students are confused.
- Student Note Taking: Are they taking notes? If so, where are they taking notes in context with the content? How many words are they typing? Early research shows that digital note taking improves learning. Check out our June 12 blog for more.
- Social feedback: Instructors can see all of the questions students asked in class. They can also learn from the conversations students are having with their peers to get a better overview of how the class is interacting with the content and gauge class comprehension.
More than just recording views, Echo360 reveals how your students are (or aren’t) interacting with your content, what’s resonating with them and what concepts leave them scratching their heads in confusion (even from the confines of their dorm rooms). Instructors have access to a student dashboard within Echo360 that provides interactive charts of behavioral data so they can intervene before a student even fails the first exam.
Want to see how all of this data comes together to give you a clear view of the big learning picture? Join us for the Live Demo on June 30!


